Subject: Answering questions with graphs!
Author:
Posted on: 2014-01-29 09:38:00 UTC
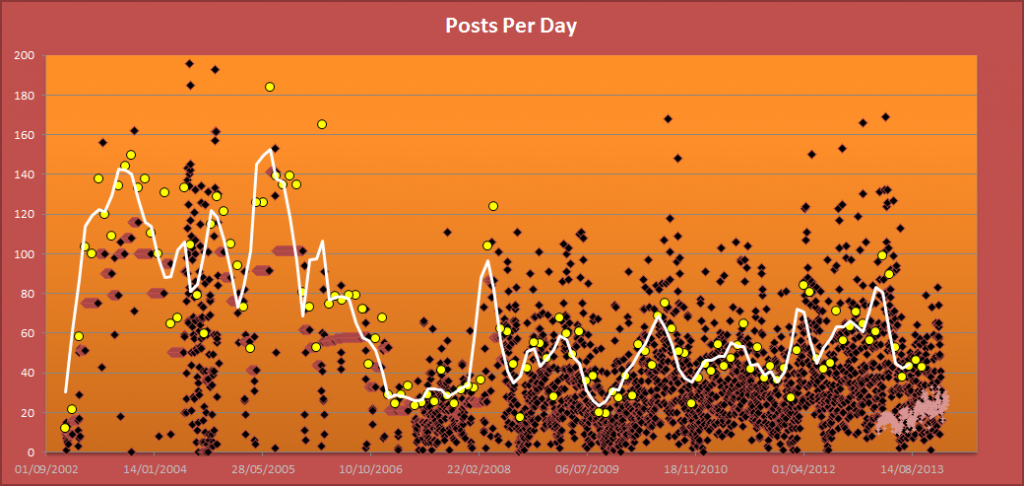
This is a plot of every single post still available in PPC Board history (I know, I know), up to December. The white line is monthly counts; the mysteriously straight rows of black points are where I've had to use averages to fill in the gaps.
You can see that we do get periodic 'slumps' - the winters of '09, '10, and '11 all show a dropoff in posts, as in fact does '13. I'm guessing that's mostly 'summer holiday/back to school/Christmas', or simply people not having much free time.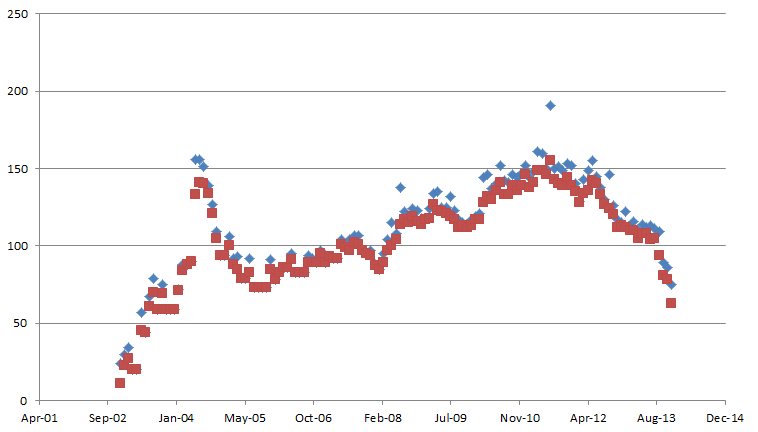
This graph is rather more fun: I looked at when a person's name first and last appears on the Board, and used that to plot the number of Boarders at any one time. Obviously it falls down when someone like Saphie comes back for one post, or when we get a second user named Artemis, but in general, it works.
The blue line is the raw data; the red is tweaked to remove users who post only in one month. A lot of those are typos, but it does eliminate the massive one-point spikes in '08 and '11 - I'm pretty sure those are the Badfic Games.
You can ignore the massive dropoff in the last four points - that's bias from people who posted, say, through to November, then just didn't say anything in December. The sloping down prior to it, since mid-'11, is real, though.
And you can see the downswing I'm talking about. In late '09, around 20 people simply... left. And I think that may well have been due to the front page vanishing. Those are the people who had the FP bookmarked, and never made the transition to the direct link. The pickup at the end, I suspect, is from us appearing on TVTropes.
You can see a similar fall in early '08, but I think that's a data artefact - due to the low number of surviving posts from that time, the data doesn't show the new people until later, and shows people leaving earlier than they actually did.
So yeah... far and away the most active time for the PPC was back in '04-'05. Since then, we've mostly been staying level. And now? Ehm... not sure. The second graph says we've got decreasing numbers of posters; the first says we have an increasing post count. And if you look at the right hand side, the grey scribble at the bottom is the number of IP addresses looking at the Board each day: that's on the increase, too (and has virtually doubled since March '13).
So there we go. Data, data, everywhere, and not a drop to drink.
hS