Subject: PPC Board Statistics
Author:
Posted on: 2013-08-15 14:00:00 UTC
Because I have so much fun putting them together, I feel I ought to share the results from time to time...
Based on the traffic information for this Board, and on copying and analysing the front page (and, in fact, all previous front pages), I've been able to generate a whole heap of graphs of various things. For example, the number of posts on the Board every day this year (up to the end of July):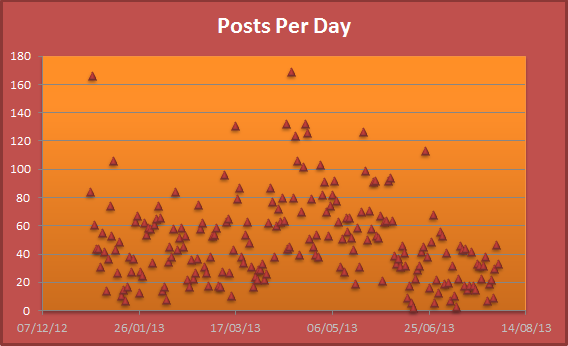
Or, related to that, the number of unique IP addresses viewing the Board every day between March and yesterday: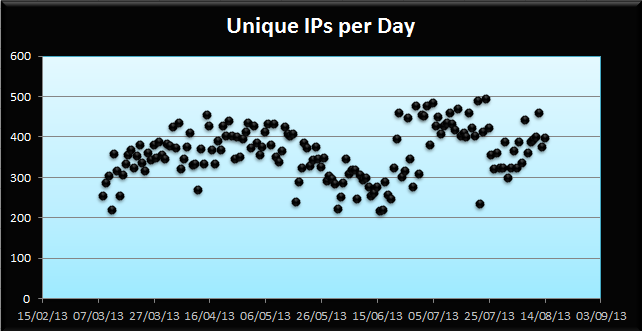
... which is going up! So either people are using more different computers during the day, or we have more visitors.
Based on that graph, by the way, and assuming PPCers use an average of two computing devices to check the Board each day (probably home computer, plus any one of work, school, phone - with some only using one), we probably have around 200 people who watch the Board right now. So that's cool.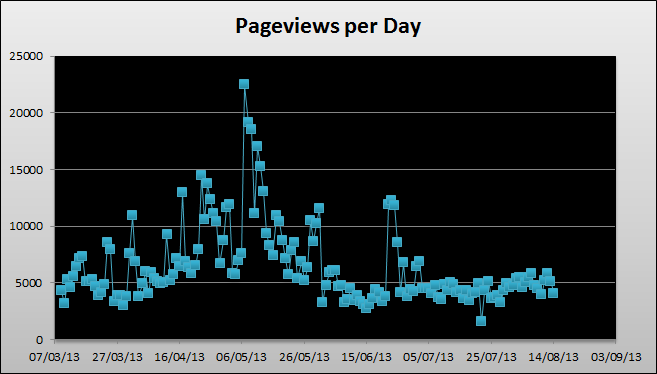
This is the number of times the Board (front page or any post) was viewed per day, again from March to now. Spikes usually represent high-traffic threads, so it looks like we've been quite calm of late.
Looking more long-term: in my processing, I've gotten back as far as October 2011 (which is 1600 threads back - the Board archives go back 4710 threads to July 2008, so I've still got a way to go). From then to this July, I've plotted the totalmonthly post count (and my personal count per month, just for giggles):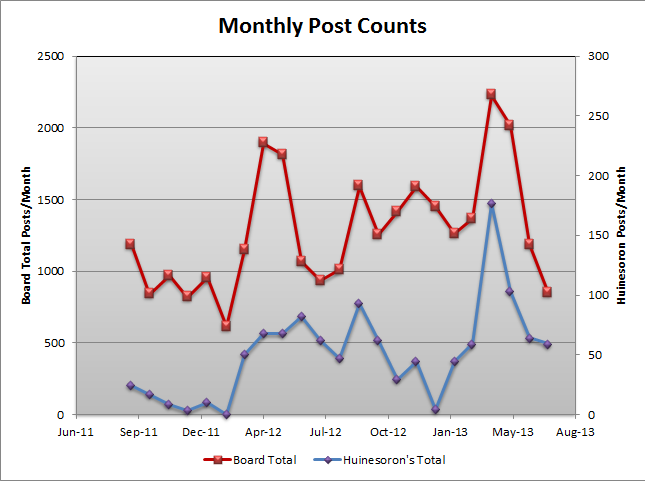
So from 2011 to now, we have an overall increase, allowing for random spikes and troughs. Also, April and May are the 'most posted-in' months - it'll be interesting to see if that extends further back.
Weirdly, my own post count seems to mirror the total, except for my drop-off at the end of last year. Quirky.
Finally (on the graph front) I created a list of everyone who's posted so far this month, which was 62 people, and matched them to the date they joined the Board.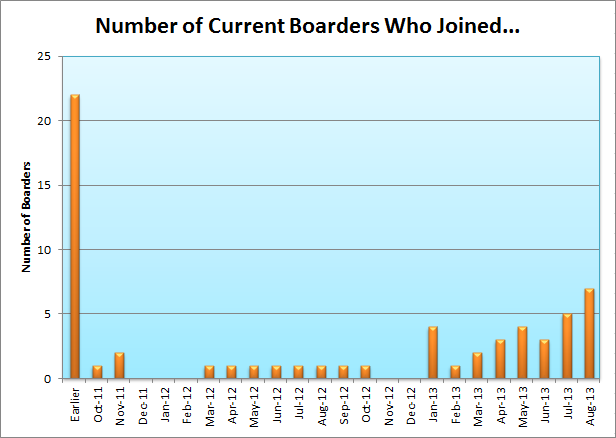
What that says to me is that essentially, people tend to drift away in their first six months on the Board. After that point, the roughly one person per month who is still here tends to stick around.
The 'Earlier' spike obviously includes Very Oldbies, such as myself and Neshomeh, but may well also include people from September 2011. All it really tells us is that about a third of the current posters have been here more than two years (less a bit).
I also took a look at this month's top ten posters:
Boarder----------Date Joined
Ayane458------------Aug-13
Neshomeh------------Earlier
sonofheaven176----Jan-13
Huinesoron----------Earlier
hermione of vulcan--Oct-12
Hieronymus Graubart-Jul-13
Outhra--------------Mar-13
Autumn_68-----------Aug-13
Desdendelle---------Oct-11
DemonFiren----------May-13
As might have been expected, a lot of the top posters are relatively new - six of those are from this year. But even so, that's a pretty decent spread. No, older Boarders don't post as much - but we're definitely still around!
And one for the Very Oldbies... as of right now, the front page holds about a week's worth of threads. At 25 threads/page, that means we're averaging 3-4 threads per day.
Wayback in 2004, we were pulling 15 threads per day. In 2006 we were still topping ten. It looks like the drop-off happened down in 2007. Does anyone have the faintest idea what changed? And, for that matter, guys: what in Arda did we spend so much time talking about?
And one final note - the Wayback Machine has near-continuous coverage of the front page for several months in the middle of 2007 - and again in 2004. Yes, I will eventually be adding that data to my stats (and mourning the inability to read the posts themselves...)
hS
.svg)