Subject: Lies, damned lies and statistics
Author:
Posted on: 2013-08-17 14:07:00 UTC
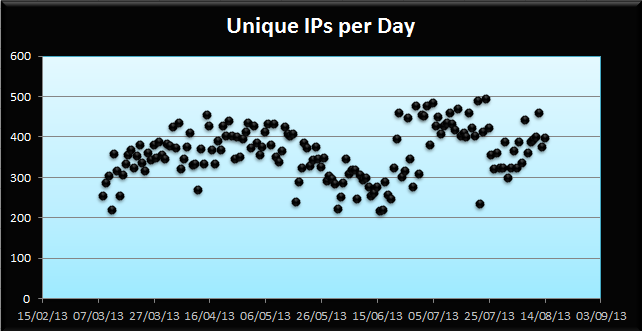
Once again, some interesting data you've collected. I'm not sure quite why, but I think that the 'Unique IPs per Day' graph has a very pleasing shape to it.
Of course, when discussing data trends and what they mean, it would be remiss of me not to mention this graph, which clearly shows the correlation between the number of pirates worldwide and global warming. Actually, the stuff you're talking about probably does have clear links, I just think it's an amusing graph and wanted to share it.
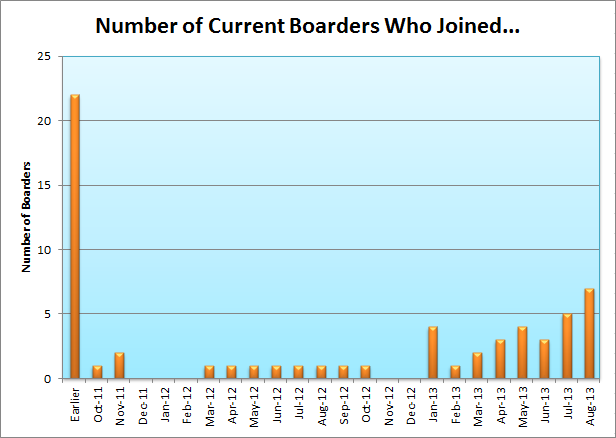
I think that little blip at March 2012 on the 'Current Boarders' graph is me :)
I wasn't around wayback when, so I can't claim any knowledge of those times, but a couple of ideas spring to mind that might explain the declining threads trend:
1) Were there just more Boarders around back then? If the community itself was larger, then it'd make sense that more new threads were being posted each day.
2) On a slightly more tenous note, this post indicates that the IRC was set up in 2006. Is it possible that back in 2004 there was more general chatting going on on the Board itself, as there wasn't anywhere else for that to be done, and that now that's mostly moved off? This is possibly supported by a few of the 2004 posts specifically noting that they are Off Topic.
Also, while the number of new threads may have dropped from 2004, several of those threads only had one or two replies, and there are a couple that didn't generate any. While we may be having fewer distinct conversations than before, it looks like the conversations that we are having are more active. It's difficult to tell, because they represent different time periods, but at first glance the current front page looks more active (in terms of general posting activity, rather than just specifically how many new threads are created per day) than that 2004 one - to me, at least.
.svg)